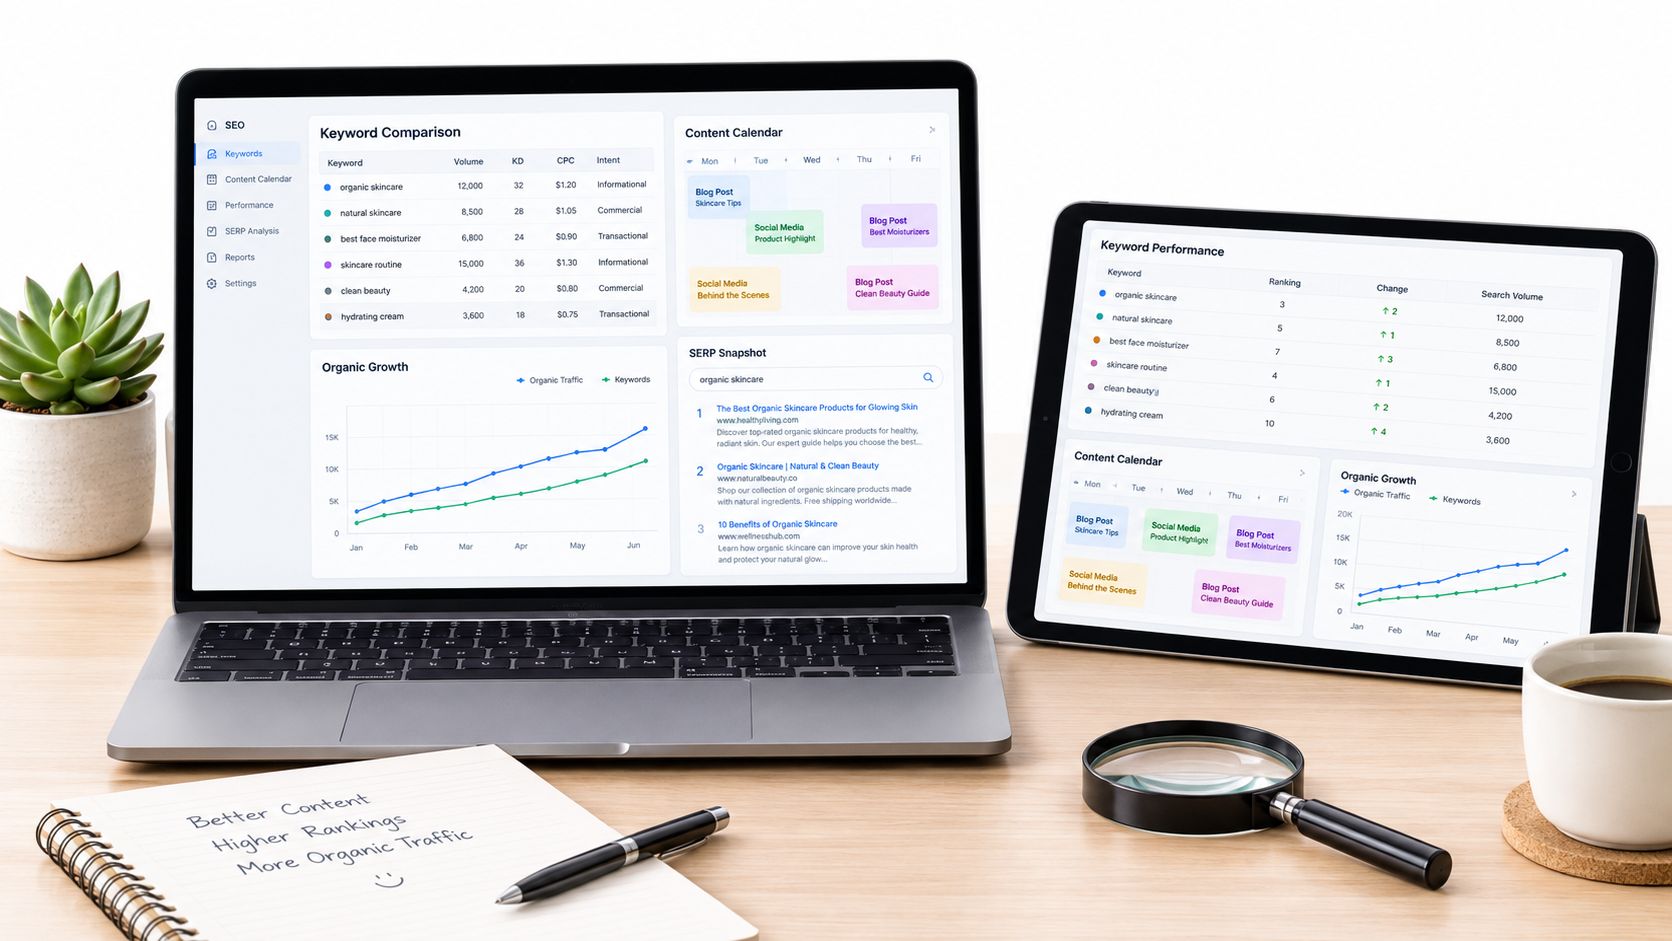


Most advice about SERP-Volatilität starts with the wrong question: “How much did rankings move?” That question can send an SEO team into a content rewrite when the change happened above the organic results, inside a local pack, or within a different device experience.
I've watched dashboards turn a messy search-result change into one alarming line. The number looked authoritative, but it didn't tell us whether our URLs had lost relevance, whether a competitor had displaced them, or whether Google had changed the page layout. The useful question is narrower: which URLs, for which intent, on which device and in which location, lost the ability to earn visibility?
SERP volatility is best treated as a diagnostic signal, not a verdict. Once you separate rankings, clicks, SERP features, and intent, you can decide whether to wait, investigate, or make a targeted change.
Inhaltsverzeichnis
- Why Most SERP Volatility Scores Mislead You
- Defining SERP Volatility the Way It Actually Works
- How Google Updates Drive Volatility in Waves
- What Actually Causes Rankings to Jump Around
- Measuring Volatility Without Chasing a Single Number
- A Diagnostic Workflow for Hit Pages
- Treating Volatility as a Segmentation Problem
Why Most SERP Volatility Scores Mislead You
Most volatility dashboards present a single market-wide reading and make rank position the unit of measurement. That's convenient for spotting unusual movement, but it's a poor basis for deciding what to do next.
A daily index can be useful as an external weather report. One current industry framing describes SERP volatility as short-term ranking change over days to weeks, represented by a daily 0–100 reading built by comparing Google results from one day with the previous day across millions of tracked keywords. That scale captures the shift from manual rank checks to continuous, large-scale monitoring, but it still compresses many different events into one market signal. Keyword.com's explanation of the SERP Volatility Index provides that broader context.
A position move from four to nine isn't equivalent to a feature reshuffle that leaves your URL at eight while a sitelink block, People Also Ask module, or AI Overview changes the space above it. Both events may affect clicks, but they require different investigations. One may indicate ranking churn. The other may indicate feature displacement, with the organic URL still relevant but less prominent.
The unit of analysis is the problem
Large trackers often pool devices, countries, industries, and query types. They may combine desktop and mobile searches, head terms and long-tail queries, and then smooth the result into a score that can lag the movement you're seeing in your own account.
That creates two common mistakes:
- Auditing too early: Teams rewrite content while a broad rollout is still moving results.
- Chasing the wrong competitor: A URL that appears to have gained may only have benefited from a feature change or intent rotation.
- Treating rank as traffic: A stable position can still produce fewer clicks when the page layout changes.
A useful analysis from CitationOS on the visibility fallacy in search makes the broader point well: visibility is not the same thing as a position report. I use that distinction whenever a dashboard says “down” but Search Console impressions and clicks don't tell the same story.
Praktische Regel: If a volatility score doesn't change your next action within the next seven days, it's probably not the metric you need.
I'd rather calculate movement against a stable, site-specific control set, segmented by device, location, intent, and feature exposure. A market-wide score can tell me that something is happening. It can't tell me what happened to my page.
Defining SERP Volatility the Way It Actually Works
SERP volatility is the degree of change in search-result pages for a defined keyword set over a defined time window. The definition becomes useful only when “change” includes the elements that influence visibility and clicks, not just the blue-link position.
I think of a market-wide volatility score like a stock-market index. The index may move, but the headline doesn't explain which sectors rotated or which individual companies changed. In SEO, the keyword set is the index, intent groups are the sectors, and individual URLs and SERP features are the tickers. An intent-segmented view tells me what shifted, for whom, and where the click opportunity went.
Four signals belong in the definition
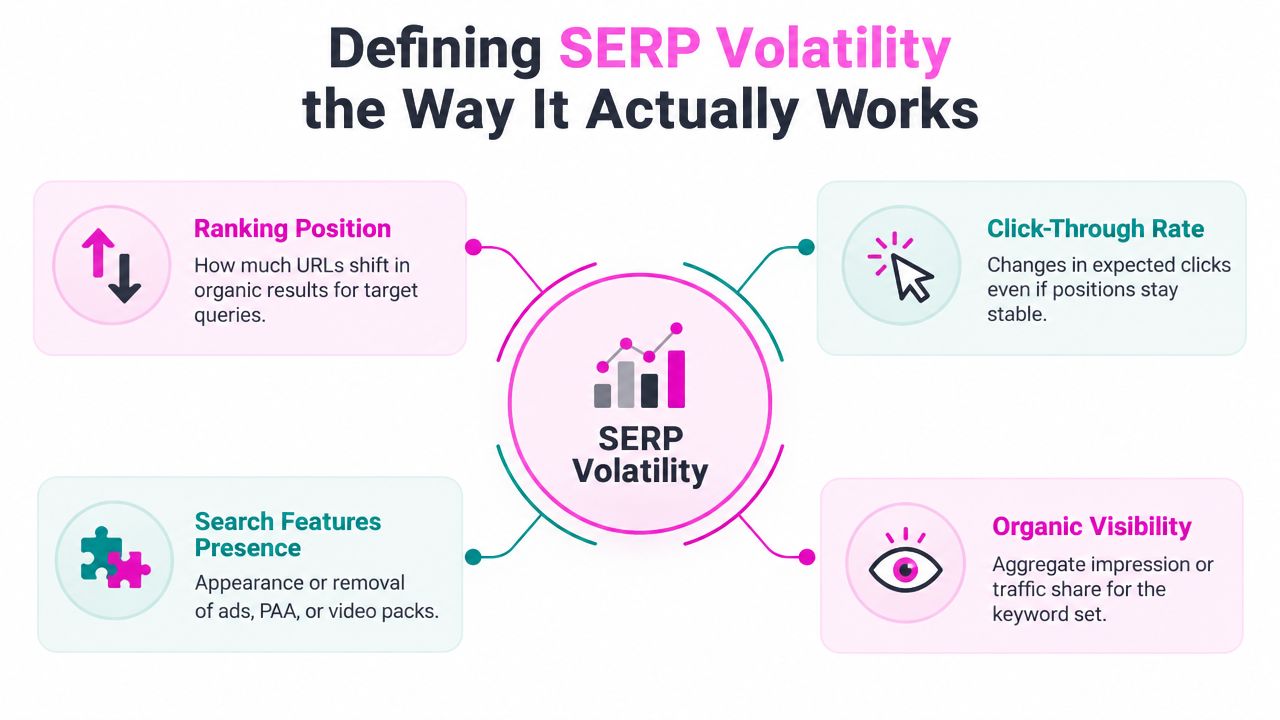
Ranking position remains important. It shows how URLs move through the organic listings for target queries. But position is only one signal, and it can be misleading when the page layout changes.
Click-through rate captures the difference between holding a position and receiving the same attention. A URL can remain in the same organic place while an AI Overview, featured snippet, video carousel, shopping module, or expanded People Also Ask block absorbs more of the searcher's attention.
Search feature presence records whether those modules appear, disappear, expand, or change composition. I track the feature itself and the URL occupying it, because a featured snippet rotation can change click behavior without a conventional ranking event.
Organic visibility combines the site's exposure across the keyword set. It can include impressions, expected clicks, share of visible results, and the URLs responsible for that exposure. The exact formula matters less than keeping it consistent and tying it to the business action you're trying to protect.
Volatility isn't the same as traffic loss
This distinction causes more confusion than any calculation method. Rankings may swing while clicks stay relatively stable, or clicks may fall while rankings hold because search features absorb demand. Intent can also shift, so a page that matched yesterday's interpretation of a query may become less suitable even if its technical SEO remains unchanged.
I diagnose volatility by comparing four layers:
- Position movement, by URL and query.
- Feature changes, by query and device.
- Impressions and click-through rate, from Search Console.
- Intent composition, based on what currently ranks.
That framework answers the question a single score can't: did the page lose visibility, or did the SERP change the way visibility is delivered?
How Google Updates Drive Volatility in Waves
An update announcement is a timestamp, not the event's complete impact. Google's March 2024 core update was announced on March 5, 2024, and Google warned that it could take up to a month, with more ranking fluctuation than a regular core update because multiple systems were being updated together. Google's announcement on the March 2024 core update and spam policies is a useful reminder that an update can create a prolonged period of movement rather than one clean spike.
I've learned not to diagnose a page from the first chart that turns red. During a confirmed rollout, I tag the announcement date, record any internal site changes, and watch how the affected keyword clusters behave through the full window. A day-one drop is evidence that something moved. It isn't evidence that the page needs rewriting.
The rollout pattern matters
Google's March 2024 update took 45 days to complete, finishing on April 19, 2024. Search Engine Land documented a major volatility spike on March 9, followed by additional peaks on March 15 und March 19, showing how movement can arrive in waves rather than as one event. Search Engine Land's 2024 Google algorithm update timeline supports the operational lesson I use with teams: compare pre-update, mid-update, and post-update data instead of treating announcement day as the verdict.
A practical timeline has three working phases:
- Announcement: Google confirms an update, but your first movement may not yet represent the settled system.
- Rollout: Ranking changes propagate and different query groups can move at different times.
- Recalibration: Results reshuffle as systems settle against the new baseline.
I keep page edits frozen during the active diagnosis unless there's a clear technical failure. Otherwise, I can't tell whether a later recovery came from Google's rollout or from my change. That loss of causal clarity makes future updates harder to manage.
The May 2026 Core update gives a particularly clear benchmark. Sterling Sky analyzed 8.16 million location-specific search-result screenshots and reported that organic rankings became 48.7% more volatile starting the week of May 18, 2026, während 97% of the reports studied became more volatile. Sterling Sky's analysis of the May 2026 Core update shows why I'd inspect mobile and geo-modified queries separately instead of relying on a blended chart.
What I record: update dates, page edits, technical releases, device splits, intent clusters, competitor entrants, and SERP feature changes. Without those annotations, a volatility chart is just a noisy timeline.
What Actually Causes Rankings to Jump Around
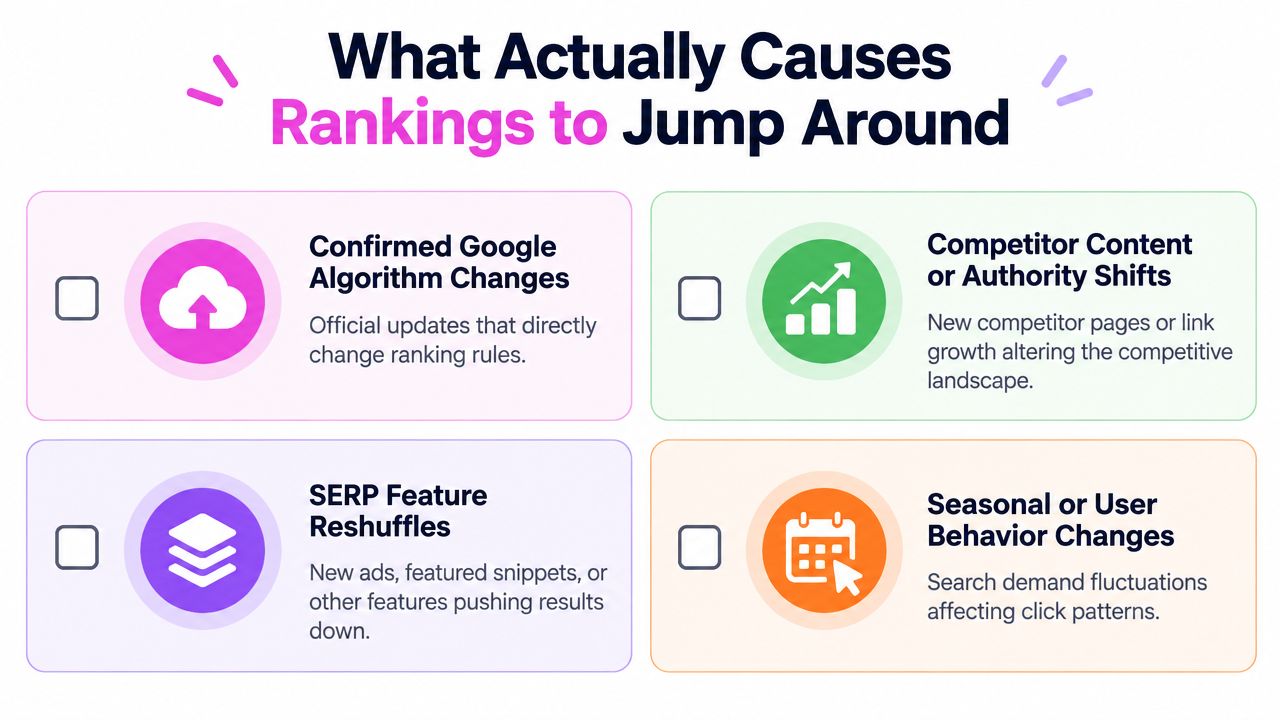
A ranking change has a cause, but the cause isn't always a core update. Before I recommend a content edit, I classify the movement into one of four buckets: confirmed algorithm change, competitor displacement, SERP feature reshuffle, or environmental noise.
Four causes, four investigations
Confirmed Google algorithm changes usually affect related query groups or content types around a documented rollout. I look for parallel movement among competitors and similar pages, then compare the timing with official update information. A broad cluster change during an update is very different from one URL disappearing while the rest of the site holds steady.
Competitor content or authority shifts leave a different footprint. A competitor URL may enter the results with a format that better matches the query, stronger topical coverage, or clearer first-hand evidence. The quickest check is a URL diff. Compare the pages that entered the result with the pages that left, not just the domains that changed position.
SERP feature reshuffles can make organic rankings look worse without reducing actual relevance. If a page moves from four to eight but the featured snippet rotates and People Also Ask expands above it, I'd check impressions, CTR, and feature presence before changing the copy.
Seasonal or user-behavior changes alter demand and click patterns. A query may attract a different audience, or Google may interpret it through a different intent bucket. That's not necessarily a site-level quality problem.
A practical classification test
I use this quick sequence:
- Did several sites and URLs move together? If yes, investigate an update or intent shift.
- Did new competitors enter with a different page format? If yes, compare relevance and format before rewriting.
- Did features appear, disappear, or expand? If yes, separate rank movement from click displacement.
- Did the change follow an internal release? If yes, inspect indexation, canonicals, redirects, and rendering.
- Is the movement isolated to one query or one device? If yes, avoid a site-wide response.
The common error is collapsing these causes into “Google changed something.” Google may have changed something, but the useful diagnosis is whether the change altered relevance, competition, page layout, or access to the URL. For readers reviewing fundamentals, this guide to improving search rankings in 2026 offers useful context on ranking considerations, but it doesn't replace inspecting the live SERP and your own page-level data.
Measuring Volatility Without Chasing a Single Number
I use three measurement layers, each answering a different question. Position-only analysis tells me how much rankings moved. Weighted visibility estimates the likely click effect. Segmented share of voice shows where my site gained or lost exposure relative to the result set.
| Methode | Data Granularity | False-Positive Risk | Best Use Case |
|---|---|---|---|
| Position-only movement | Keyword and URL position | High when SERP features change | Fast screening for broad ranking movement |
| Weighted SERP visibility | URL, position, feature, and click model | Moderate because click models are assumptions | Estimating whether movement likely affects clicks |
| Segmented share of voice | Device, geography, intent, URL, and feature | Lower when the control set is stable | Deciding where to investigate and prioritize |
What each method misses
Position-only standard deviation is easy to calculate and easy to misunderstand. It treats every position change as comparable, even though moving within the top results may have a different business impact from leaving the visible result set. It also ignores whether the URL still occupies a featured result.
Weighted visibility improves the model by assigning different expected click values to positions and features. The trade-off is transparency. A click curve is an estimate, not observed behavior, so I validate it against Search Console impressions and CTR rather than presenting it as fact.
Share of voice is the most operationally useful when I segment it properly. I separate device, geography, intent, page type, and feature exposure, then compare the same stable keyword set over time. A market index tells me that search results changed. Site-internal share of voice tells me whether my commercial or informational visibility changed.
External indexes from tools such as Moz, Semrush, and SERPstat are valuable for context, but they don't replace internal tracking. They often provide breadth and benchmarking, while a rolling site-level score provides relevance to your pages. For teams monitoring AI-generated result surfaces as well as conventional rankings, a curated review of AI search monitoring tools can help frame the wider measurement problem.
The dataset I'd trust
I want a long enough daily history to see normal behavior for each template, query intent, device, and location before assigning meaning to a volatility score. A short sample can mistake a temporary spike for a baseline shift. I also inspect live and historical result pages, using a live SERP checker when a recorded position needs to be reconciled with what searchers saw.
My rule is simple: track the measurement that changes a decision. If the number doesn't tell me whether to wait, inspect a feature, compare a competitor, or audit a page, it's decorative reporting.
A Diagnostic Workflow for Hit Pages
When a page appears to have been hit, I don't start by editing the introduction or adding keywords. I first establish whether the page lost real exposure and whether the same pattern appears across related queries.
Seven checks before changing the page
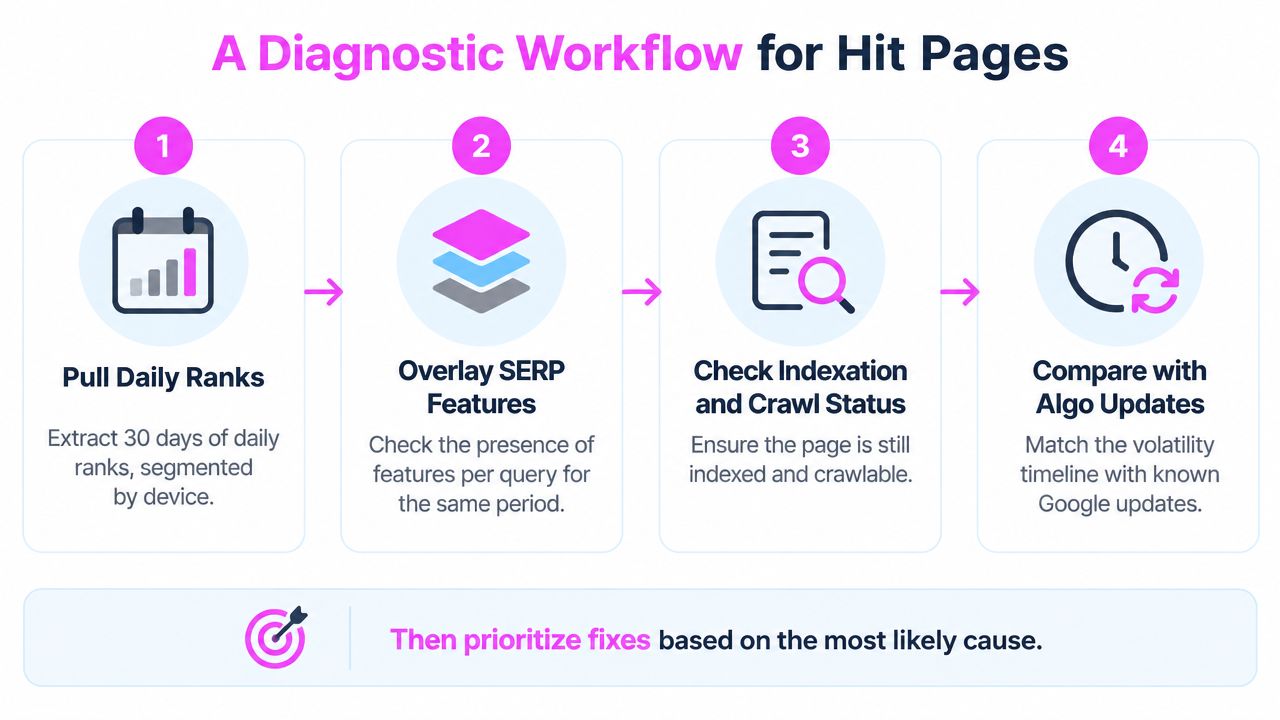
Pull daily ranks by device. Extract the affected page's daily positions for the recent observation window and split desktop from mobile. If only one device moved, don't prescribe a site-wide content fix.
Overlay SERP features. Record whether AI Overviews, featured snippets, local packs, shopping modules, video results, or People Also Ask blocks changed for the same queries. If position holds but clicks fall, feature displacement becomes the leading hypothesis.
Check Search Console impressions and CTR. A rank decline with lower impressions is different from stable impressions with lower CTR. The first suggests reduced exposure. The second points toward a changed results page or weaker result presentation.
Verify indexation and canonical signals. Inspect the URL, canonical selection, robots directives, redirects, and crawlability. A page can appear to suffer from volatility when Google is choosing another URL or failing to process the intended one.
Compare intent clusters. Group related queries by informational, commercial, transactional, navigational, or local intent. If one page loses several closely related queries, that's stronger evidence than one isolated keyword moving.
Run a competitor URL diff. Identify the URLs that replaced your page and compare their format, topical coverage, evidence, freshness, and intent match. Look for what changed in the result set, not only what changed on your page.
Overlay update timing. Compare movement with confirmed Google update windows and your internal release calendar. A synchronized industry move deserves patience. An isolated post-release drop deserves technical investigation.
The two shortcuts that waste the most time are re-optimizing before confirming that impressions fell, and rebuilding content before checking whether rankings merely rotated within the same intent bucket. Both create work without improving the diagnosis.
If those checks don't produce a coherent signal, treat the movement as normal variance. I'd wait through a complete update cycle before making a structural change.
For ongoing review, a SERP volatility tracker can help preserve the timeline, but the tool only becomes useful when the team records page changes, features, competitors, and devices alongside the score.
Treating Volatility as a Segmentation Problem
Volatility stops being one number as soon as I split it by device, geography, intent, and SERP feature exposure. The same keyword can show a stable desktop result in one market, a lower mobile result in another, and no meaningful organic opportunity where a local pack dominates the page.
That's why I build a four-axis matrix before deciding whether a ranking change is serious. The axes don't add complexity for its own sake. They prevent a blended average from hiding the segment where the business is losing visibility.
| Achse | Segment | What You Measure | Diagnostic Signal | Correct Response |
|---|---|---|---|---|
| Device | Desktop, mobile | Position, features, CTR | Movement isolated to one device | Inspect mobile layout, feature mix, and page experience |
| Geography | Country, region, city | Localized URL and feature presence | Change limited to a market | Review local intent, competitors, and result composition |
| Intent | Informational, commercial, transactional, local | Cluster visibility and ranking URLs | One intent group shifts | Adjust format and relevance for that intent |
| SERP feature | AI Overview, featured snippet, local pack, video, shopping | Presence, ownership, and click effects | Position stable but clicks change | Optimize for the feature or reassess expected organic demand |
What segmentation changes operationally
Device-segmented tracking prevents mobile losses from disappearing inside a desktop average. A page may rank acceptably on desktop while mobile features compress the organic results and reduce practical visibility.
Geo-weighted reporting keeps large markets from masking local instability. A national average can look healthy while a priority city loses the local result that drives qualified visits.
Intent-bucketed reporting reveals whether Google has changed the kind of page it wants. If informational queries remain stable but commercial queries rotate toward category pages, refreshing a guide may not solve the problem. The page type may be wrong for the current interpretation.
Feature-occupancy tracking shows whether your URL remains visible in the formats searchers notice first. Current guidance increasingly treats volatility as movement in rankings, URLs, features, and interpreted intent, rather than organic position alone. The SEOS guide to search volatility discusses that wider definition and the diagnostic difference between ranking movement and traffic loss.
The payoff is attribution. Once volatility is segmented, false alarms fall away and real losses attach to a specific axis. That's the level where I can choose the right response, whether that means waiting, improving a page, targeting a feature, fixing technical access, or changing the page type.
SemDash lets you inspect historical SERP results, map keywords to the exact ranking URLs, classify intent, compare competitors, and review AI Overviews citations alongside conventional visibility. Visit SemDash to investigate volatility by device, geography, intent, feature, and page instead of reacting to a single market-wide score.