

A keyword falls from position 3 to position 6 overnight, and the first question in the team chat is whether Google penalized the page. That's the wrong first question. One ranking is one observation, not enough evidence to diagnose a penalty, a content problem, or even a lasting change.
I track Google SERP volatility as change across the result set, split into two signals: position movement among ranking pages and URL churn, the pages entering or leaving the tracked results. That distinction changes the response. A position shuffle with the same URLs calls for a different investigation than a set of new competitors replacing half the top 10.
Inhaltsverzeichnis
- What SERP Volatility Measures and Why Rankings Move Daily
- How to Calculate a Volatility Score Step by Step
- Start a Two-Week Volatility Baseline Before Editing Anything
- Matching Volatility Spikes to the Update Timeline
- Reading Volatility Patterns and Their Likely Causes
- Monitoring Workflow and Alert Rules That Stay Quiet
- Why Volatility Changes Planning and Reporting
What SERP Volatility Measures and Why Rankings Move Daily
A single page's rank is like a thermometer reading in one room. Volatility is the weather index for the whole city. The first tells you what happened to one result; the second shows whether the wider search environment is shifting.
I read volatility at three levels. One keyword tells me how a specific result set changed. A keyword cluster shows whether related searches moved together. A market or language reveals whether the movement extends beyond one topic or country. A position drop on one commercial query is a very different signal from many unrelated clusters moving at once.
The measurement is an observation, not a cause. Volatility describes what changed in the rankings and URLs between snapshots. A Google update is an announced change to ranking systems. Results can move without an announced update, so matching a date to a ranking dip isn't enough to prove the update caused it. Google's ranking documentation also explains that positions can fluctuate as the web changes, and some movements can reverse without intervention.
Separate the signal from the diagnosis
Google confirmed seven algorithm updates in 2024, compared with nine in 2023, laut Search Engine Land's year-by-year update count. Updates are part of normal search operations, but that doesn't make every fluctuation an update effect. I look for corroboration: whether several clusters changed, whether the ranking URLs rotated, and whether the timing aligns with an official rollout.
Volatility measures change in the result set, not a verdict on your page.
That's why I don't treat one bad daily reading as a penalty. First establish whether the movement is isolated or shared, positional or URL-based, temporary or persistent. Then investigate the likely cause.
How to Calculate a Volatility Score Step by Step
A useful score depends on consistent inputs. If the keyword list, location, device, or collection time changes mid-measurement, the score may reflect tracking changes rather than Google's results.
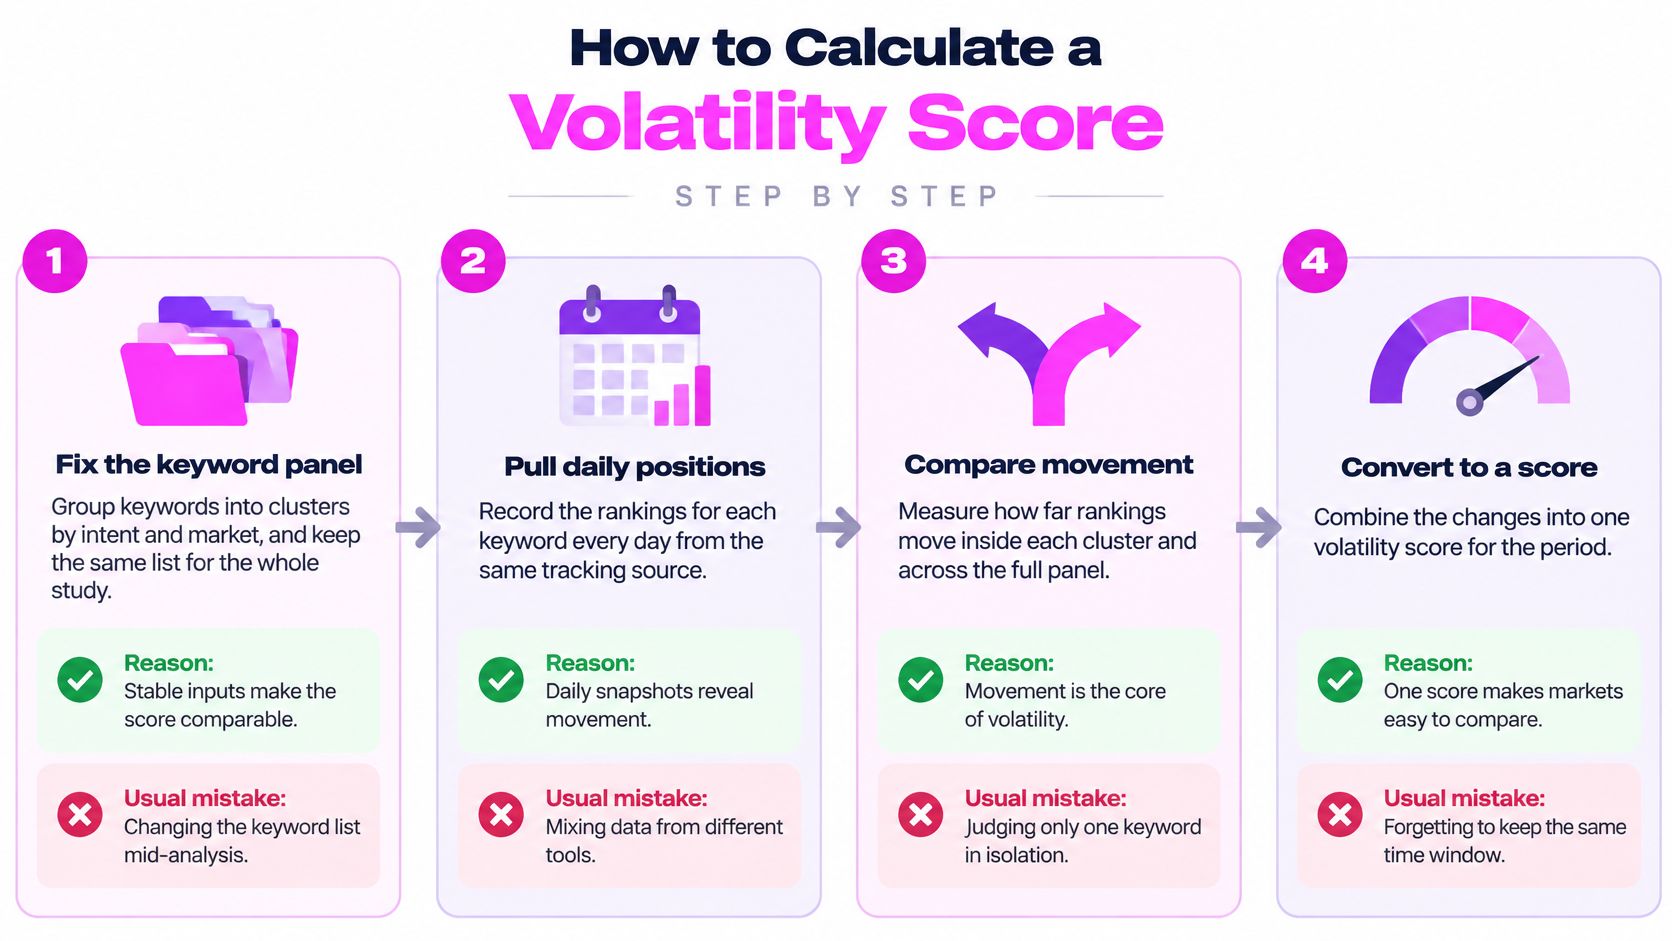
Fix the keyword panel. Group keywords by intent and market, then keep the same panel throughout the measurement period. This makes daily results comparable; the common mistake is adding or removing queries during a spike, which creates artificial volatility.
Capture the same results every day. Record the top 10 or top 20 organic URLs at the same local time, using consistent country, language, and device settings. Localization, personalization, and intraday changes can shift results; mixing settings or collection times muddies the comparison.
Store each snapshot as an ordered list. Keep the URL, position, date, and market for every result. That record lets you measure both rank movement and membership changes; saving positions without URLs hides whether a different page took over.
Measure positional movement. For each keyword, compare today's positions with the previous snapshot and record the absolute change. Use the cluster median rather than the mean, so one large jump doesn't dominate; the usual slip is averaging a handful of extreme movements into a misleading cluster story.
Calculate URL replacement rate. Count the share of today's top 10 URLs that weren't in yesterday's top 10. This captures churn that position-only scores miss; don't mistake a small movement by the same URLs for a large change in result-set membership.
Give deeper entries more weight. A page rising into the top 10 from beyond position 20 is a larger competitive change than a shuffle among pages already in the top 10. Search Engine Land reported that the share of URLs in Google's top 10 that had previously ranked beyond position 20 rose from 6.46% during the November 2023 core update to 9.38% during the March 2024 core update in its comparison of March 2024 core-update observations.
Combine the signals and compare with a baseline. For each cluster, divide the day's median absolute position change by its rolling median, and divide its URL replacement rate by its own rolling median. Average those two ratios with equal weight to start. A score of 1.0 means ordinary movement for that cluster; 2.0 means twice its normal movement. Start with equal weights, then adjust only after 30 Tage show which signal better predicts actual clicks. Tuning weights after a couple of noisy days gives false precision.
There's no universal “healthy” score. The meaningful comparison is with the cluster's own baseline, measured using a stable panel and the same collection method.
Start a Two-Week Volatility Baseline Before Editing Anything
Don't edit a page until movement holds across at least two days and you've checked it against Google's update timeline. That rule is only useful if the team knows what ordinary movement looks like first.
Start with 50 keywords from one market and one cluster. Capture a daily top 10 snapshot at a fixed local time for 14 days, then calculate each day's median absolute position change and URL replacement rate. Two weeks gives you an initial view of normal movement in both directions, instead of letting one unusual week define “normal.”
The 14-day pilot seeds a rolling baseline; it doesn't cover a full monthly cycle. Extend the baseline to 30 days before enabling monitoring alerts, and don't confuse that initial pilot with a mature threshold.
SemDash can help with the historical comparison: its SERP Checker lets users view the SERP over 12 months for any keyword, and its URL-level mapping shows the specific page Google sends traffic to. That makes it faster to check whether a keyword's ranking URL changed. SemDash's SERP data covers 600 million SERPs, which gives teams a broader reference point for checking whether a movement appears beyond their own panel.
At the end of the pilot, write down a baseline for each cluster and the alert rules everyone agrees to follow. If the team can't state what counts as unusual and what happens next, the baseline isn't operational yet.
Matching Volatility Spikes to the Update Timeline
A single date isn't enough to attribute a spike. Google rollouts can run for days or weeks, and updates can overlap. I mark each confirmed update's start and end on the daily volatility chart, then check whether movement begins at the start, lags it, or continues after the window closes.
The March 2024 core update ran from March 5 to April 19, about 45 days, while a separate spam update ran concurrently from March 5 to March 20, about 15 days. A drop on the tenth day may still be part of the rollout, and overlapping changes make it harder to isolate one cause. By contrast, the December 2024 core update ran from December 12 to December 18, about six days. If a decline persists well beyond that window, the update date alone isn't a sufficient explanation. Google's ranking history provides the confirmed dates and rollout durations.
| Update | Type | Start | End | Approx. duration |
|---|---|---|---|---|
| March 2024 core update | Core | March 5, 2024 | April 19, 2024 | About 45 days |
| March 2024 spam update (ran concurrently) | Spam | March 5, 2024 | March 20, 2024 | About 15 days |
| August 2024 core update | Core | August 15, 2024 | September 3, 2024 | About 19 days |
| November 2024 core update | Core | November 11, 2024 | December 4, 2024 | About 23 days |
| December 2024 core update | Core | December 12, 2024 | December 18, 2024 | About 6 days |
| August 2025 spam update (global, all languages) | Spam | August 26, 2025 | September 22, 2025 | About 27 days |
Use a control cluster
Compare the affected cluster with unrelated clusters over the same dates. If several unrelated groups rise together, that's stronger evidence of wider system-level turbulence than a single cluster moving on its own. A narrow movement may instead point toward changing relevance, freshness, or the result layout for that intent.
The scale of search changes makes dated evidence especially useful. Google reported 4,781 search-related launches in 2023, compared with approximately 350–400 in 2009, in a comparison published by Moz. That count isn't a volatility score, but it reinforces why I use official timelines and controls rather than assigning every fluctuation a single cause.
My attribution rule is strict: a spike that aligns with a confirmed window, appears across unrelated clusters, and persists after the window closes is a candidate for an update effect. If it doesn't meet that bar, return to the baseline and investigate the result set before anyone changes a page.
Reading Volatility Patterns and Their Likely Causes
The same drop can come from a broad update, a relevance shift, cannibalization, or harmless reshuffling. Those causes need different responses, so I read the pattern before recommending a fix.
Say a 40-keyword cluster moves together across unrelated topics on the same day. I'd check Google's official update timeline first, because broad movement across unrelated groups is more consistent with system-level turbulence than a page-specific issue.
Now say only a commercial-intent cluster moves while informational queries stay flat. I'd compare the page types occupying the top 10 before and after. If the results shift toward product pages, comparison pages, or local listings, the search intent or SERP layout may have changed. I'd also check the market: during Google's global, all-language August 2025 spam update, which ran from August 26 to September 22, I'd compare winners and losers within each language, not average results across countries. The Google Search Status Dashboard incident record confirms the global rollout. Local competitors, localization quality, and demand can change which pages qualify in each market.
| Observed pattern | Likely cause | First check |
|---|---|---|
| Whole cluster moves together across unrelated topics | System-wide change or broad update | Compare dates with Google's official update timeline |
| One intent cluster moves while others stay flat | Shifting search intent or changed SERP layout | Compare page types in the top 10 before and after |
| Two URLs from the same domain swap positions | Cannibalization or intent reassessment | Map the ranking URL for each keyword over the same period |
| Position drops but the ranking URL and CTR hold | Harmless reshuffle or SERP feature change | Check impressions and click-through rate for the same queries |
| Movement appears in one country or language only | Market composition change | Compare winners and losers within that market only |
| Movement reverses within 3 to 7 days with no edits | Normal SERP instability | Record it, hold changes, and keep watching |
The most costly mistake is editing during the first days of a rollout, then losing the ability to tell whether the page changed because of the edit or the ranking system. Another is using one keyword as a proxy for its entire cluster. Hold changes until a repeatable pattern points to a specific cause.
Monitoring Workflow and Alert Rules That Stay Quiet
Alerts should flag confirmed patterns, not every daily wobble. A useful monitoring workflow combines a market-specific baseline, clear triggers, a named owner, and a response tier. Without those, notifications train the team to ignore the system or to edit pages before the evidence is ready.
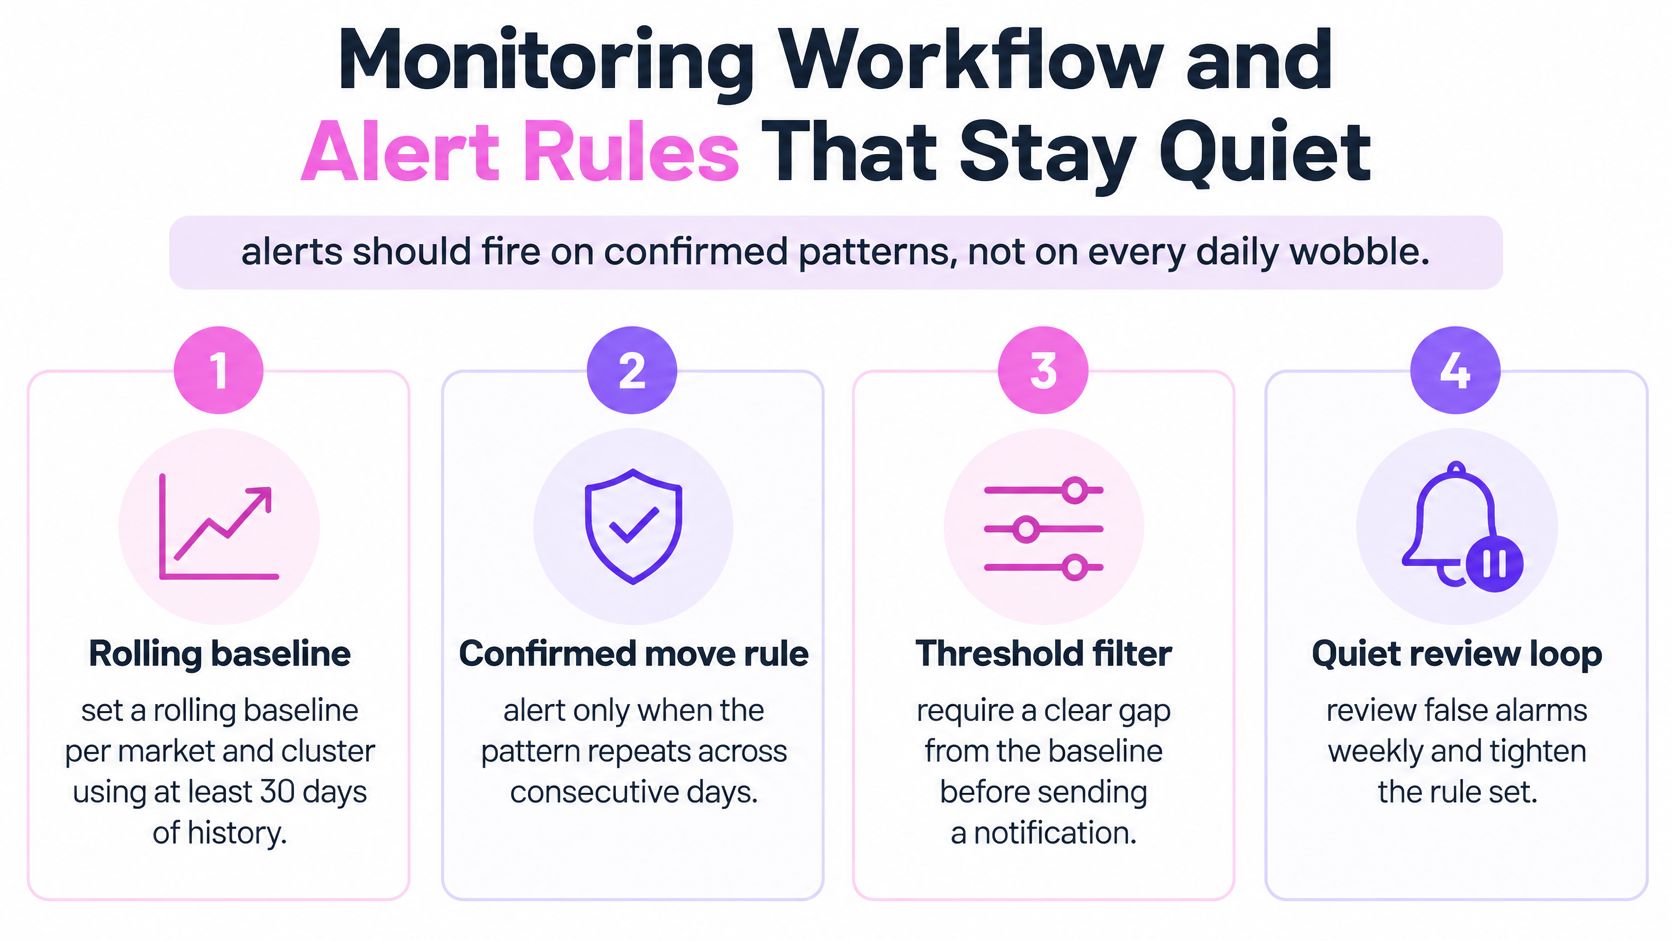
Build and refresh the baseline. Use at least 30 days of history per market and cluster, and recompute it monthly. A baseline pooled across countries or intents can make a localized shift look ordinary, or ordinary movement look alarming.
Set combined alert triggers. Send an alert when the cluster's median absolute position change exceeds its baseline for three consecutive days, the URL replacement rate doubles, or a tracked URL leaves the top 20 for its cluster. A single keyword dip shouldn't trigger an alert; the point is to require a repeated or consequential change.
Assign one owner to each cluster. The owner checks the update timeline, intent, and competing URLs when an alert arrives. Without a named decision-maker, alerts become a shared inbox nobody feels responsible for resolving.
Match evidence to a response tier.
- Watch: Log the movement only when it's brief or doesn't cross the cluster threshold.
- Investigate within 48 hours: Check the update timeline, intent, ranking URLs, and competing pages when the pattern persists or URL churn rises.
- Act: Rewrite, consolidate, or redirect only when the investigation identifies a durable page-level issue, such as overlapping URLs or a sustained intent mismatch.
The false-positive log matters as much as the alert history. Record which alerts reversed without edits and which led to meaningful changes, then use that evidence to refine thresholds. Common failures are alerting on single keywords, treating every alert as an edit request, and skipping the log that makes future baselines more accurate.
SemDash's SERP Checker keeps 12 months of history per keyword, which helps teams build baselines without exporting data. Its per-keyword URL mapping also shows which page is ranking when an alert fires, so the investigation starts with the actual result rather than a sitewide average.
Why Volatility Changes Planning and Reporting
Industry rank-tracking data showed Google desktop rankings were 26% more volatile in 2024 than in 2023, while mobile rankings were 16% more volatile. Search Engine Land reported those figures using industry rank-tracking data in its coverage of Google ranking volatility. That's a reason to plan for ranges and investigation, not to assume every page needs a rewrite.
A page at position 4 can look stable on average and still move enough on some days to affect clicks. Pages near the top 3 or close to the top 10 boundary deserve closer monitoring because small movements can change visibility more sharply than similar movement deeper in the results. That's exactly why a single latest position makes a poor forecast.
For reporting, show the cluster median position, the interquartile spread, and how many queries moved beyond the cluster baseline. A daily-position chart without context invites clients to ask about every dip, even when URLs, impressions, and conversions remain steady. I'd send a monthly summary that separates ordinary movement from changes that crossed the team's agreed threshold.
Budget for investigation before rewrites. Early movement often settles or points to a market-level change rather than a page defect. Put time aside to validate the pattern, check the ranking URLs, and review performance by query group before assigning content or engineering work.
SemDash combines historical SERP views, URL-level keyword mapping, and volatility checks to help you distinguish position movement from URL rotation. Use SemDash to review the result sets behind your tracked keywords and build a monitoring workflow grounded in your own market baselines.